Towards an Operational Methodology for Land Cover
Mapping
The Fast Track Approach
Source Data Gallery
Stratification
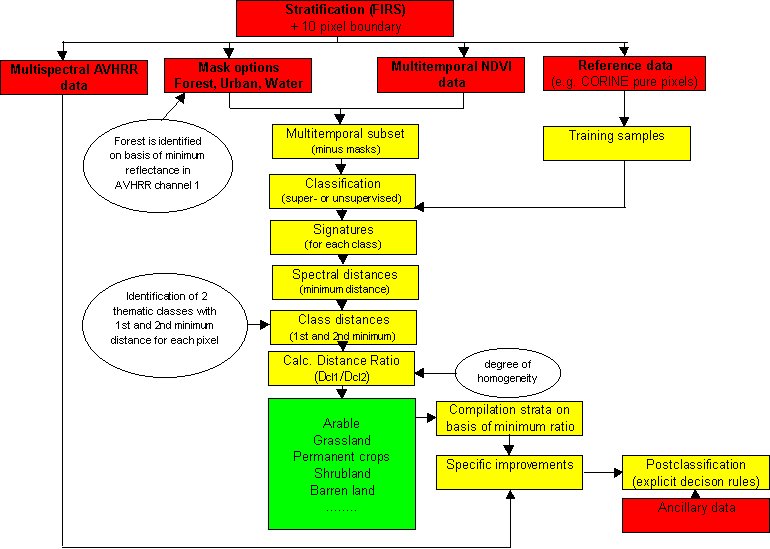
Within the framework of PELCOM a fast-track classification methodology has been developed that is applicable for pan-Europe (figure 8). The PELCOM classification scheme consists of nine major land cover classes: forest, grassland, rainfed arable land, irrigated land, urban area, permanent ice and snow, barren land, wetlands and water bodies, all important for environmental studies. Working on such a large area as the whole of Europe makes stratification a prerequisite. The purpose of any stratification is to divide the area of interest in strata that are more homogeneous in LULC and in phenology than the area as a whole. Successive classification of different strata with a priori known land cover classes enables improvement of the discrimination process on difficult classes and reduction of the number of misclassifications due to spectral confusion (Thunnissen et al. 1993). Such a stratified approach improves the accuracy and detail of the classification. In the framework of the FIRS (Forest Inventory by Remote Sensing) project of SAI/JRC (Space Applications Institute of the Joint Research Centre), a regionalization and stratification was made for European forest ecosystems (Kennedy et al. 1994, Husson et al. 1994). The 115 strata constituting the output of the FIRS stratification were found to be suitable for PELCOM.
Data and preprocessing
A major AVHRR data source is the MARS (Monitoring Agriculture by Remote Sensing) archive at SAI/JRC. The archive has two components: SPACE generates daily AVHRR mosaics, while the SCAN system extracts parameters, such as NDVI from daily mosaics (SAI/JRC 1996). Presently, SPACE ingests AVHRR 10 bit raw data in the SHARP-1 format (ESA 1989). It calibrates the data, detects clouds, corrects channels 1 and 2 for atmospheric effects, navigates the data using an orbital model and automatically detected ground control points (GCP's) and outputs the five channel data in a given projection over a predefined area (Kerdiles 1996). Unfortunately, GCP's are frequently lost on the coast due to cloud coverage, which regularly causes low geometric accuracy. For that reason, MVC's derived by SCAN did not meet the required quality. Instead, a multi-temporal data set was processed by the SMART (''Smoothing AVHRR Reflectances Technique'') algorithm, which has been developed by SAI/JRC. The algorithm contains the following steps (Loudjani et al. in prep.): - missing data, high scan angle rejection, - scan angle effect correction, -cloud screening, - sharp variation rejection, - weighted moving average smoothing - and time interpolation. The algorithm processes directly the values from the visible and near-infrared channels and gives the end-user the opportunity to choose his own vegetation index.
Masking
The SMART database forms the core of the classification procedure. Clustering techniques will be applied to the SMART database containing smoothed profiles for VIS and NIR channels on a daily basis. As mentioned before, forests are not satisfactorily identified in a clustering procedure. In a supervised classification forests can be identified on individual multi-spectral scenes using channels 1, 2 and 3 (ESA 1992, Mücher et al. 1994). However, such an approach is hampered by frequent occurrence of clouds. Therefore, identification of forests was implemented on the basis of thresholding the synthesis of visible reflectance of AVHRR channel one (Champeaux and Legleau 1995, Champeaux et al. in prep). For this purpose Europe was divided into eight different regions and for each region the best time period was selected, resulting in specific thresholds for each region. The result was a reliability of 80 % and an accuracy of 60 % when compared with CORINE aggregated to a 1.1-km spatial resolution and a 75 % homogeneity threshold. Additional masks were produced for water bodies (by integration of various sources: Digital Chart of the World (DCW) and Bartholomew Euromaps) and urban areas (DCW, Bartholomew Euromaps and CORINE). Before any classification, these masks are applied on all AVHRR data. Subsequently, an unsupervised classification is executed on the SMART data per stratum.
Classification
The number of clusters per stratum depends on the diversity of land cover types expected for the stratum in question. Visual interpretation of cloud-free multi-spectral AVHRR scenes, training samples derived from the CORINE land cover database and/or statistical data from the region can help to determine the adequate number. Next an unsupervised classification is performed on the SMART data that will result in a set of spectral signatures representing the cluster statistics for each stratum. These clusters do not necessarily represent the required land cover classes, but might reflect heterogeneous areas consisting of several land cover types. In order to define those clusters that represent homogeneous land cover types the subsequent classification is based on the first and second likeliness. For each pixel the minimum and second minimum distance will be calculated and the relevant cluster assigned to two image layers, i.e. each pixel will receive a first and a second likely class number. In addition, the ratio between the first and second distance is computed and assigned to a third layer. The ratio between the distances can be used as a measure for the "pureness" of the single pixel. A pixel that is located close to one cluster mean will have a very low ratio whereas a pixel that is located in the middle between two clusters will have a ratio close to one.
Next a number of training sets is compared to the three layers. The training sets are derived from homogeneous areas of the CORINE land cover database, i.e. areas of one or several AVHRR pixels that contain a high percentage of one, and only one, CORINE land cover class. First all "pure" pixels - i.e. pixels that have a small ratio - that fall into one of the training sets are determined and labeled according to the respective land cover class. In an ideal case each cluster would represent exactly one training set and the classification would be finished. In reality it is most likely that both a number of clusters and a number of training sets will remain unrelated. The reason is that these training sets are spectrally located between two or more of the remaining clusters, i.e. they build what we call "virtual" clusters. But these "virtual" clusters can be defined by the ratio between the distances from real clusters. Classification of pixels that fall in such a virtual cluster can be performed by simple rules. A rule such as "find all pixels that have first and second class assigned n or m and a ratio close to one" would create a virtual cluster that is located between cluster m and cluster n.
The last step should not leave any training sets but might leave some clusters unrelated. These clusters refer to land cover types that are not represented in the training sets or to disturbances in reflection due to temporal cloud cover. In order to classify those remaining areas multi-spectral AVHRR data will be applied. For each stratum the results from the unsupervised classification will be compared interactively with the visual information in the multi-spectral AVHRR scenes. The information in either the multi-temporal or multi-spectral AVHRR data will be strongly influenced by the quality of the concerned data and the specific land cover features present in the specific stratum. If specific features, e.g linear features, and specific land cover classes are only visible in the multi-spectral AVHRR scenes they will be derived from these scenes by a supervised classification.
In order to experience the advantage and/or limitations of the proposed
Fast Track Approach (FTA) the method is tested for Western Europe. The
followed procedure and results of this experiment are described in this
document. This should give insight into the opportunities of FTA and enable
us to make decisions for further classification purposes.
Schematic overview of proposed
first track PELCOM approach
Study Area
As much as possible of the West European area has been taken into account during this experiment. For the west European area this means Denmark, Germany, The Netherlands, Belgium, Luxembourg and France. More specifically, in terms of FIRS strata, the following 22 strata has been subjected to the approach:
4, 17, 24-31, 39-50.
Input data
According to the proposed FTA the following data were used as input (Source Data Gallery).
Before any FTA processing, the urban areas, forests and water were
masked from the multitemporal NDVI-SMART database. Next the individual
strata are clipped from the masked SMART database. Before clipping 10 pixels
region growing was performed. The purpose of this is twofold. First it
enables us to validate interpretation in the overlapping zone between two
adjacent strata. Secondly this enables us to realise an optimal compilation
after classification.
Data processing
A first step towards classification considers an unsupervised classification of the isolated part of the NDVI-SMART database. The number of clusters was determined according to the size of the area, the visual interpretation of the heterogeneity in SMART data, multispectral data and , if available, the reference database (CORINE 1100_meter). The number of clusters in this study area varied from 7 up to 12 per stratum. The maximum number of clusters is limited for practical reasons (e.g. incorporation in the prob_max model). The main output of this unsupervised classification is the signature file.
Next, the individual signatures from the signature file are used for supervised classification of the area. The main output of these classifications are the distance files (minimum distance is used as parametric rule). These files should contain the minimum distance to the respective signature on a pixel basis. Hence a stack layer with all distance files (equivalent with number of clusters) should support miminum distances to all individual signatures.
In order to determine the most likely and second most likely signature (class1 and class2), the distance layer stack should/can be processed in the prob_max model. For practical purposes I made several derivates of this model for strata with different number of clusters (prob_max7, , prob_max12). As recognised by Jean-Louis an error occurred in the original prob_max model (see attached file for new version or replace 255 by the maximum value of the dist_stack layer). For each of the models 6 output files are being stored in a temporary directory.
After processing the prob_max model class1 was. Therefore multispectral data and reference data are being used in combination. While some of the clusters will appear to represent the same class (e.g. arable land) others will appear more unique. Obviously only part of the clusters can be labeled straightforward by one of the respective land use/land cover classes. For those clusters that seem to contain considerable amounts of different land cover types, labeling of class1 is not straightforward at all. For these pixels it is assumed that class2 (the 2nd most likely class) might be of overriding importance. However, recoding is considered conditional. Two conditions which are used for this area are as follows:
Results
(See compilation of classified stata:
.)
Discussion, Conclusions and Recommendations